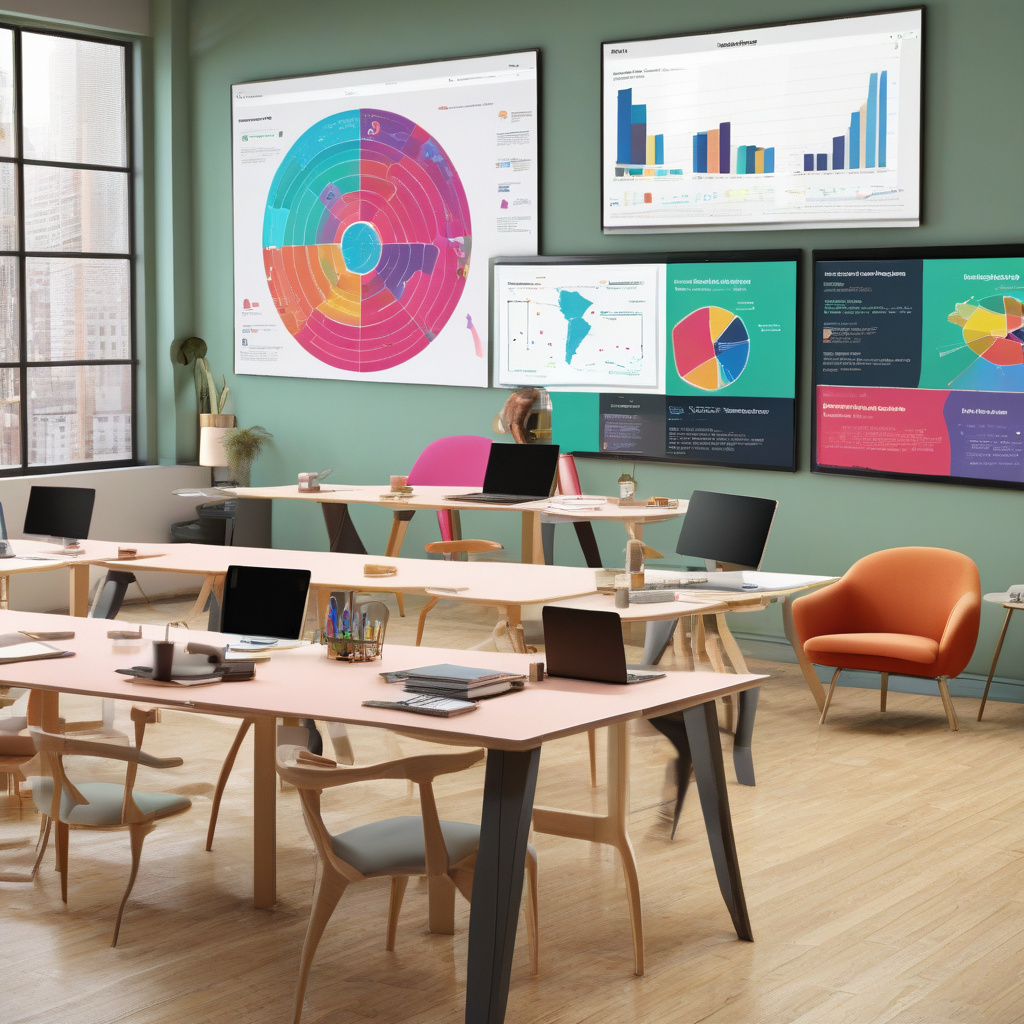
Unlocking the Power of Data-Driven Storytelling: Canva’s Integration with Google Analytics
In the fast-paced world of digital marketing, the marriage of data and storytelling has become increasingly crucial for brands looking to captivate their audience and drive conversions. Canva, the popular graphic design platform, has taken a giant leap in this direction by integrating live data from Google Analytics into its platform, empowering marketers to create visually compelling narratives backed by real-time insights.
Imagine being able to seamlessly connect your website’s performance metrics, such as traffic sources, page views, and conversion rates, directly to your design projects. With Canva’s new integration with Google Analytics, this is now a reality. By bridging the gap between data and design, marketers can craft visually engaging reports, infographics, and presentations that not only look stunning but also communicate complex data in a digestible format.
One of the key benefits of this integration is the ability to streamline the reporting process. Instead of manually exporting data from Google Analytics into a separate design tool, users can now pull live data directly into their Canva projects. This not only saves time but also ensures that the information presented is up-to-date and accurate. Whether you’re preparing a performance dashboard for a client presentation or creating an infographic for a marketing campaign, having access to real-time data can significantly enhance the impact of your visual content.
Moreover, the integration with Google Analytics opens up a world of possibilities for personalization and customization. Marketers can now dynamically populate their designs with data-driven elements, such as charts, graphs, and tables that automatically update as the underlying data changes. This level of interactivity not only makes the content more engaging but also allows viewers to interact with the data in a more meaningful way.
Another advantage of incorporating live data into design projects is the ability to track and measure the performance of visual content. By linking specific metrics from Google Analytics to elements within a design, marketers can gain valuable insights into how their audience is engaging with the content. For example, you can track the click-through rate of a call-to-action button in a presentation or monitor the scroll depth of an infographic on your website. This data-driven approach enables marketers to optimize their designs based on real-time feedback, ultimately leading to better results.
In conclusion, Canva’s integration with Google Analytics represents a significant step forward in the realm of data-driven storytelling. By empowering marketers to combine the power of visual design with real-time data insights, this partnership enables brands to create more impactful and engaging content. Whether you’re looking to enhance your reporting capabilities, drive conversions, or simply improve the overall effectiveness of your visual communication, the integration of live data into your design projects is a game-changer that shouldn’t be overlooked.
#Canva, #GoogleAnalytics, #DataStorytelling, #DigitalMarketing, #ConversionOptimization
